
Area chart
Use area for magnitude over time. Stacking answers composition questions; overlaying answers direct trend comparison.
When to use
Section titled “When to use”Choose area when magnitude is part of the message. Choose line when the filled baseline would exaggerate differences.
Minimal example
Section titled “Minimal example”Add this element to a native Blade view after installing the package. The example includes its data; replace the values with your own.
<native:area-chart class="w-full h-80" :series="[ [ 'id' => 'revenue', 'name' => 'Revenue', 'color' => '#ED3F16', 'points' => [ ['id' => 'jan', 'label' => 'January', 'value' => 18], ['id' => 'feb', 'label' => 'February', 'value' => 26], ['id' => 'mar', 'label' => 'March', 'value' => 31], ], ], ]" area-mode="stacked" :style="['area' => ['opacity' => 0.35]]" a11y-label="Revenue magnitude by month"/>Native preview
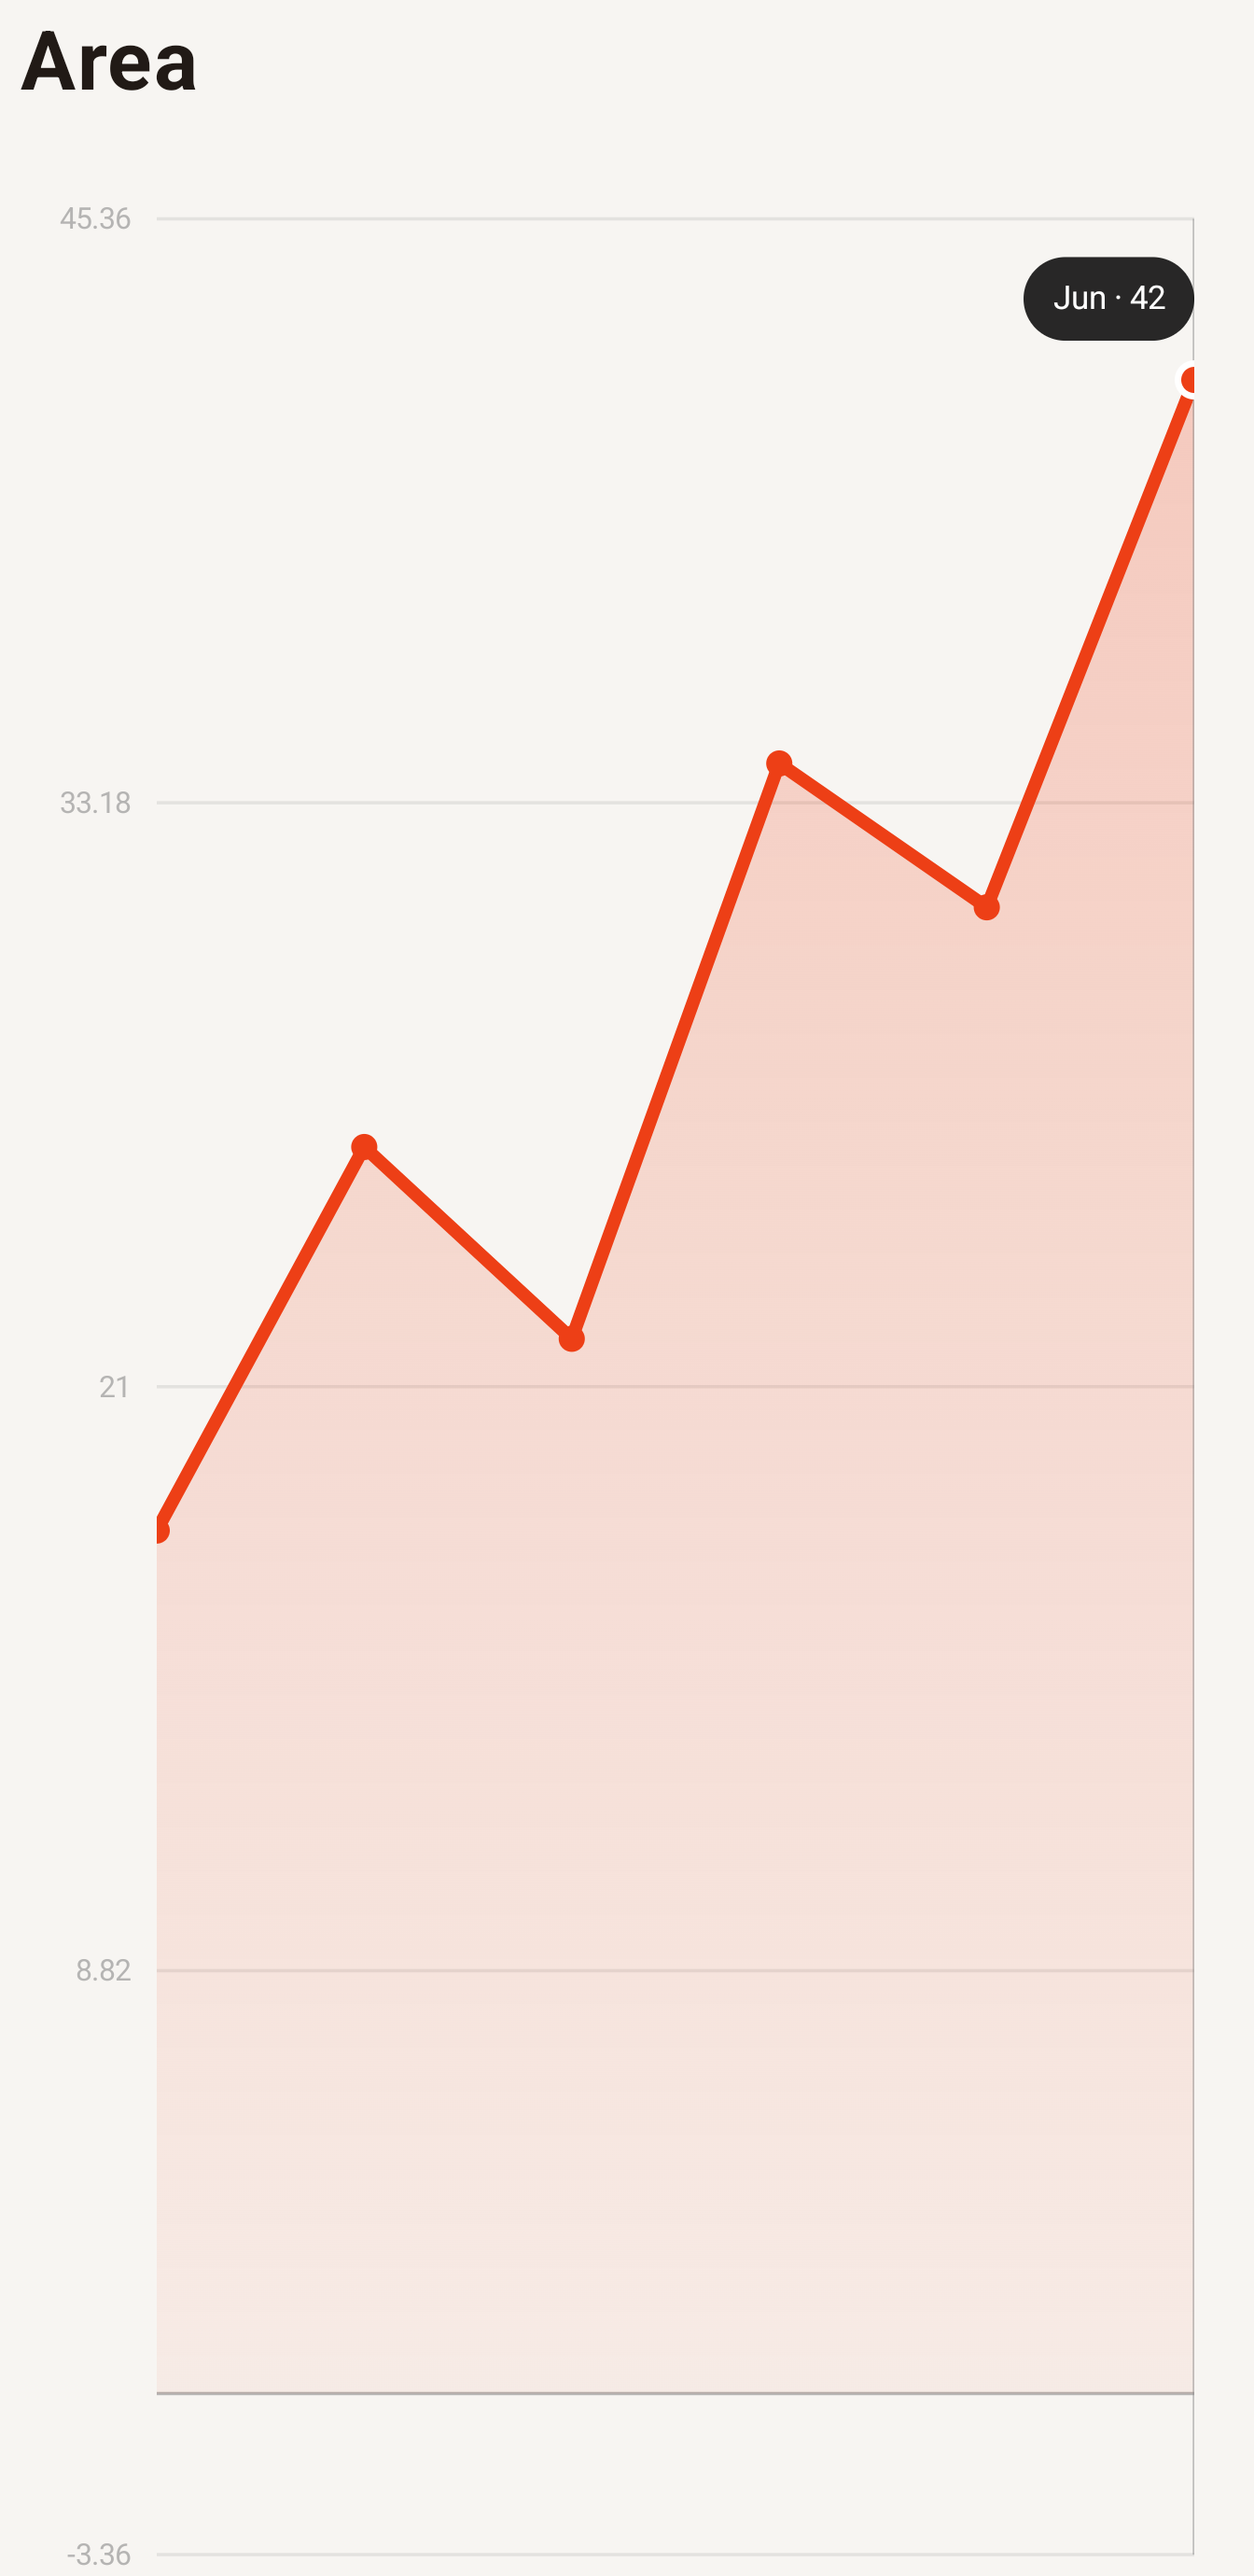
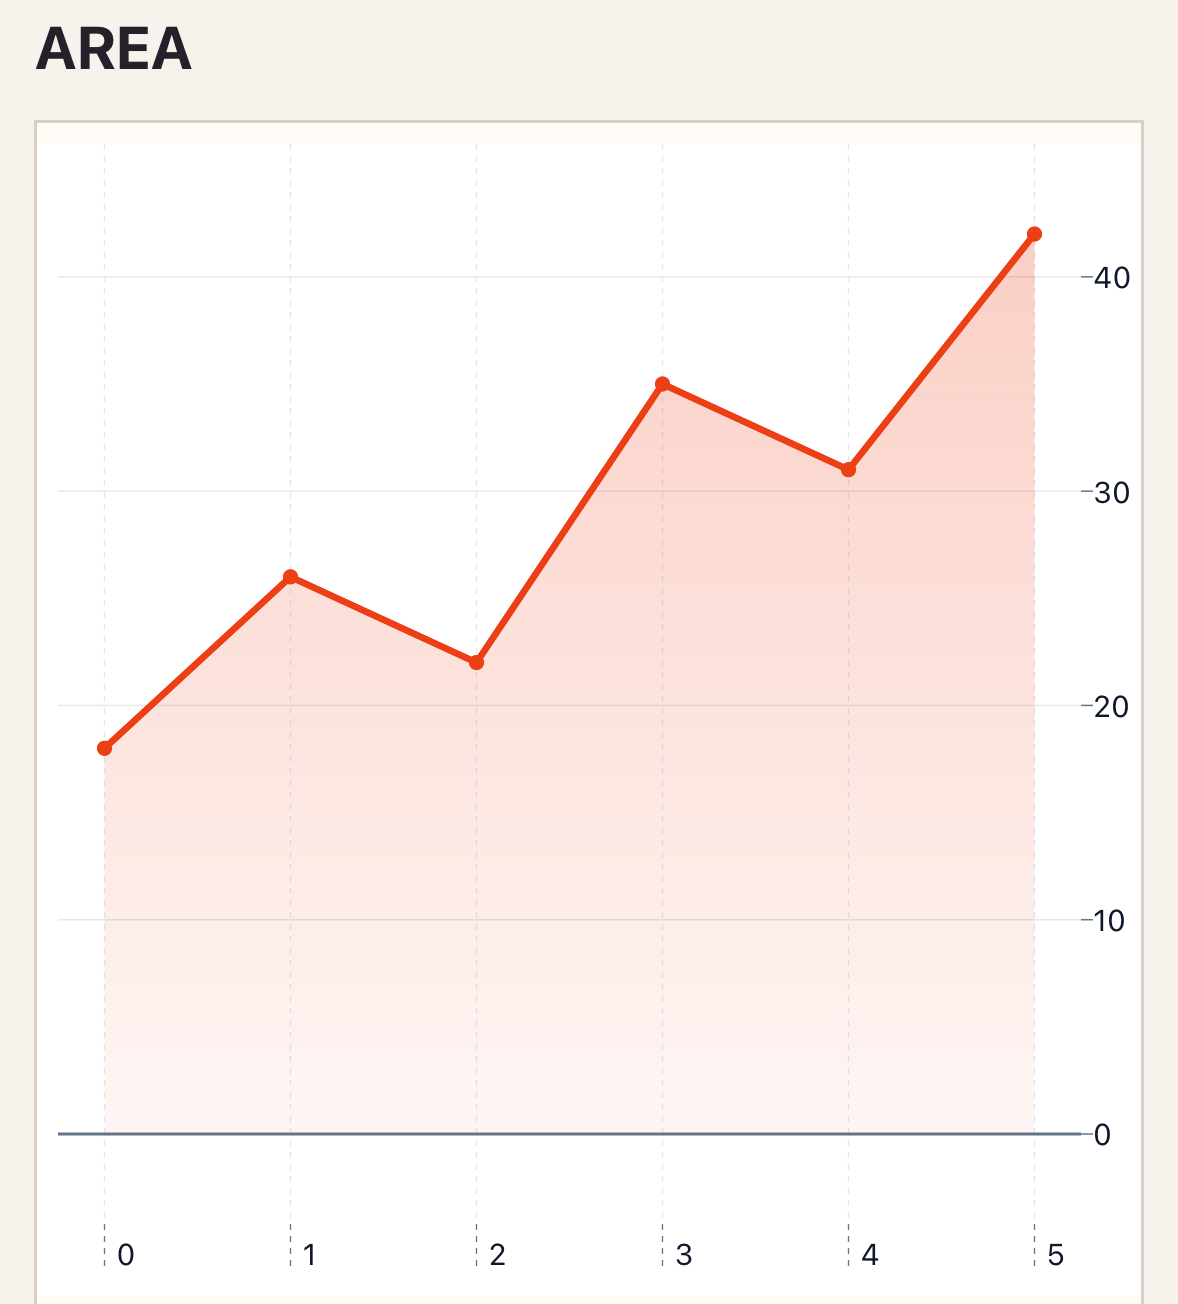
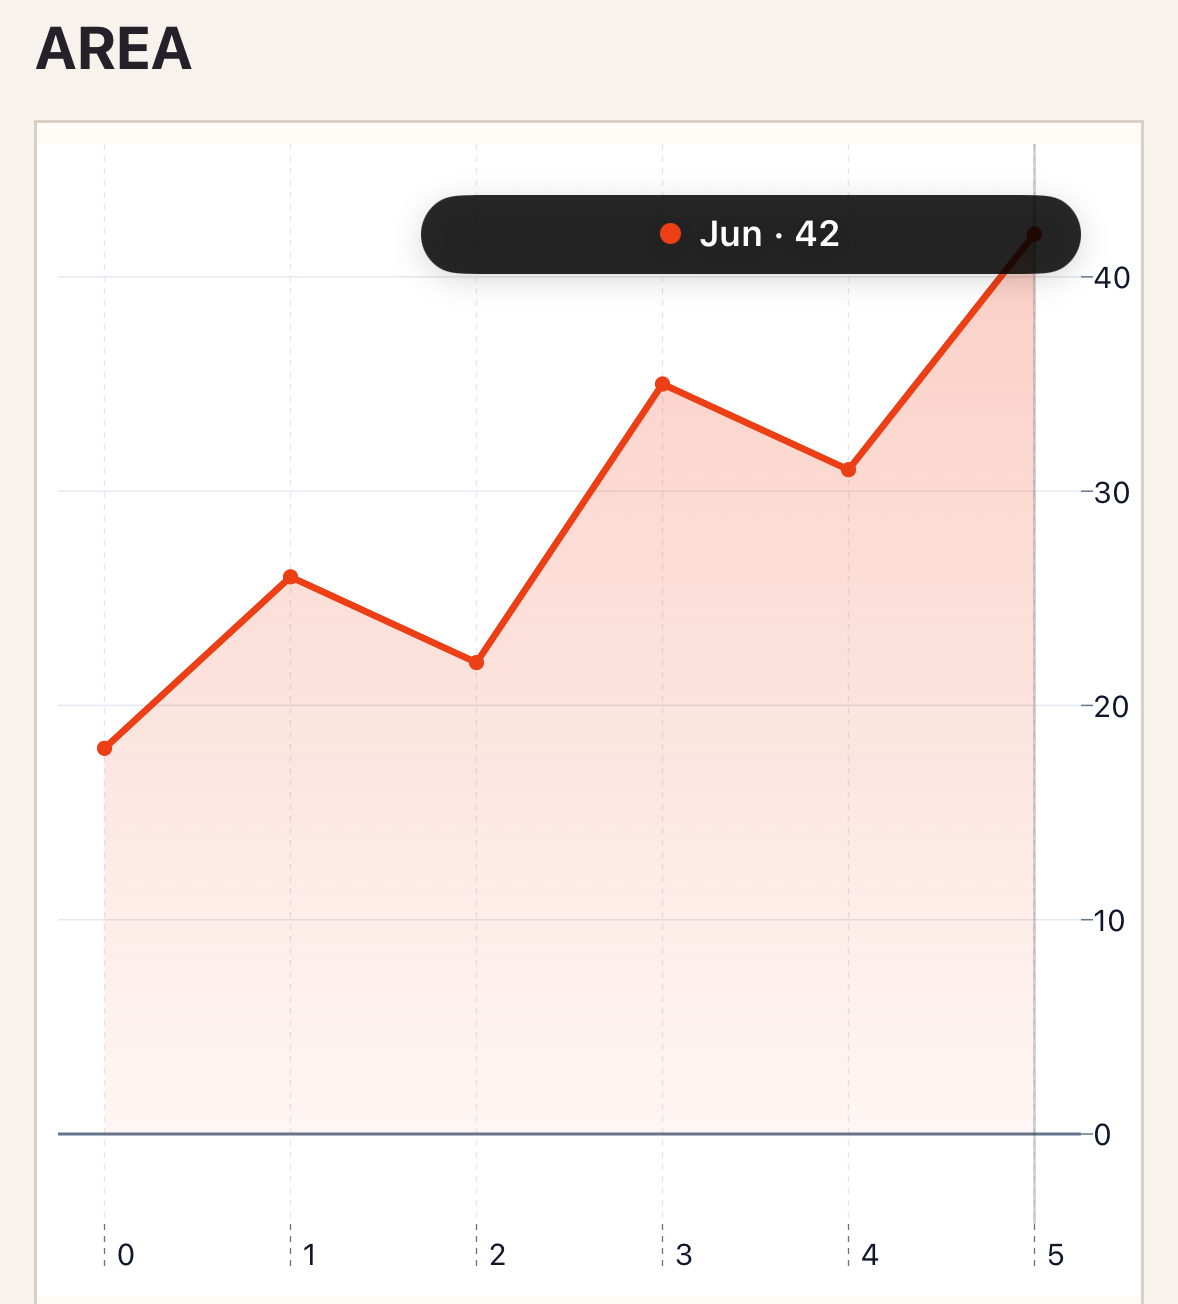
Section titled “Native preview”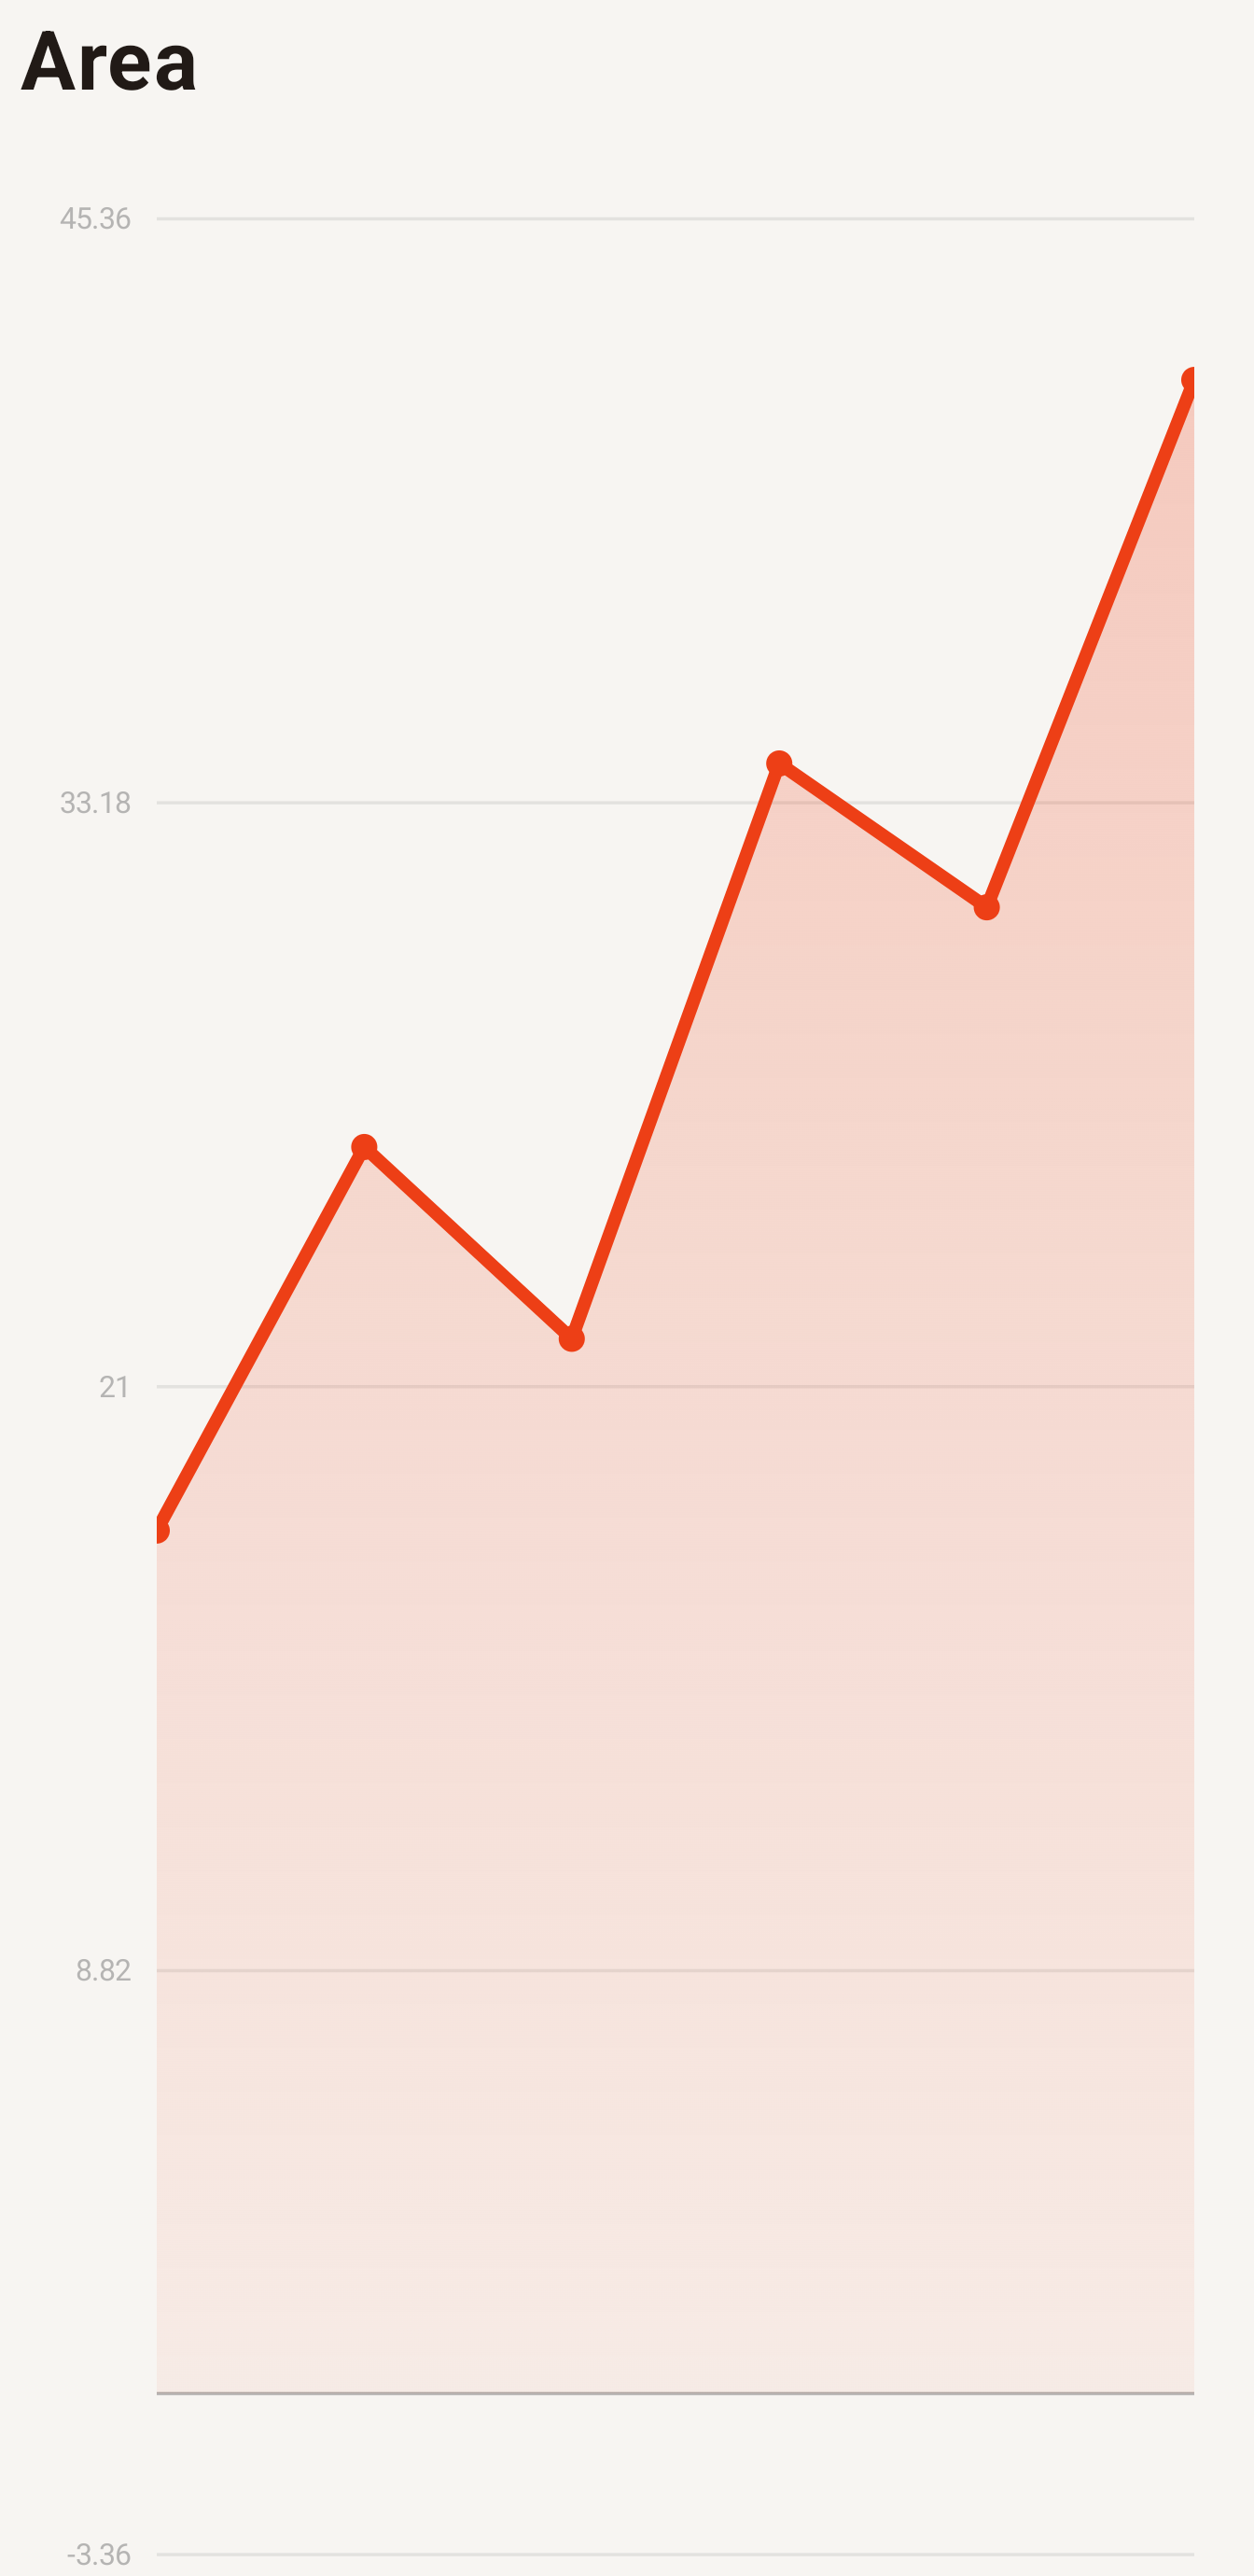
Variants
Section titled “Variants”area-mode="overlay" compares shapes; area-mode="stacked" shows a changing total and its composition.
Customization
Section titled “Customization”The area fill, boundary line, points, grid, axes, theme, and preset remain semantic across both renderers.
See the style options reference for supported keys and ranges.
Interaction
Section titled “Interaction”To handle selection, add _select="selectPoint" and define the method shown in Callbacks and interactions.
Use stable point IDs for selection and use a numeric, date, or datetime viewport only when users need to pan or zoom.
Empty and error states
Section titled “Empty and error states”Empty series render empty-label. Invalid PHP data raises an InvalidArgumentException; a snapshot rejected by the native renderer displays error-label.
Accessibility
Section titled “Accessibility”Describe each series and its unit. Do not rely on fill color alone; preserve distinct legend names.
Area adds area-mode (or stacking) and the area style section to the common Cartesian contract.
Troubleshooting
Section titled “Troubleshooting”If a stack appears wrong, confirm every series uses the same ordered x domain. See themes and accessibility.