
Scatter chart
Scatter points require numeric x values by default. Give every observation a stable point ID.
When to use
Section titled “When to use”Choose scatter to inspect correlation, clusters, gaps, and outliers between two measures.
Minimal example
Section titled “Minimal example”Add this element to a native Blade view after installing the package. The example includes its data; replace the values with your own.
<native:scatter-chart class="w-full h-80" :series="[ [ 'id' => 'observed', 'name' => 'Observed', 'color' => '#ED3F16', 'points' => [ ['id' => 'one', 'label' => 'One', 'x' => 1, 'value' => 8], ['id' => 'two', 'label' => 'Two', 'x' => 2, 'value' => 13], ], ], ]" :x-axis="['type' => 'number']" :style="['points' => ['size' => 7]]" a11y-label="Response time compared with request volume"/>Native preview
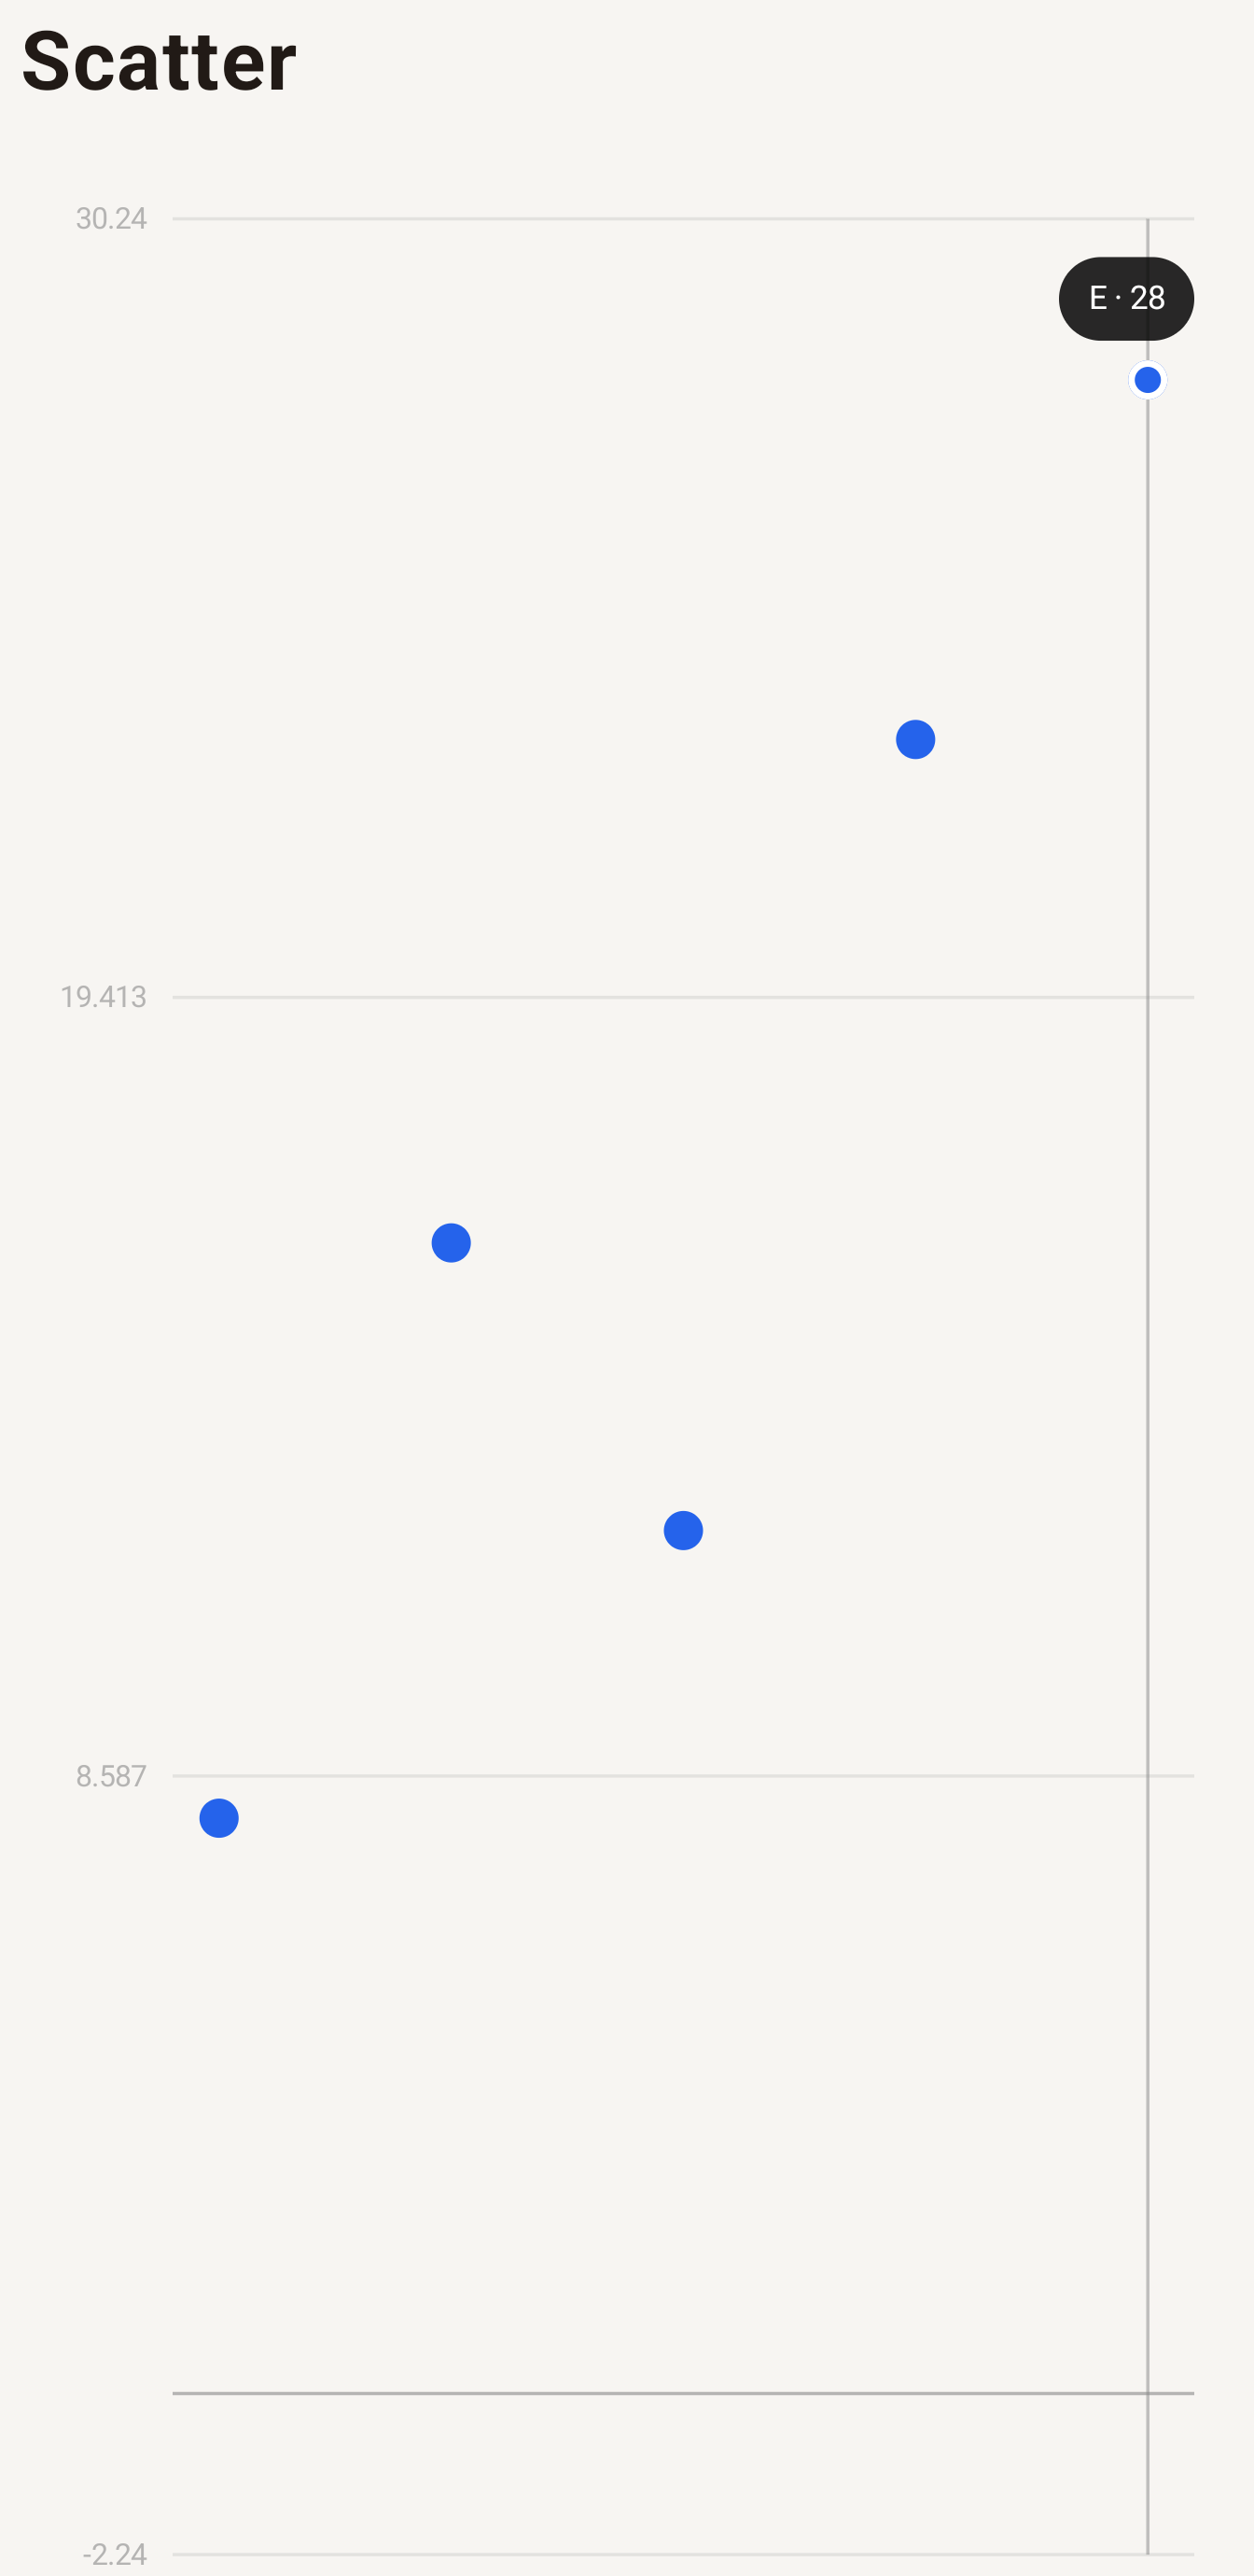
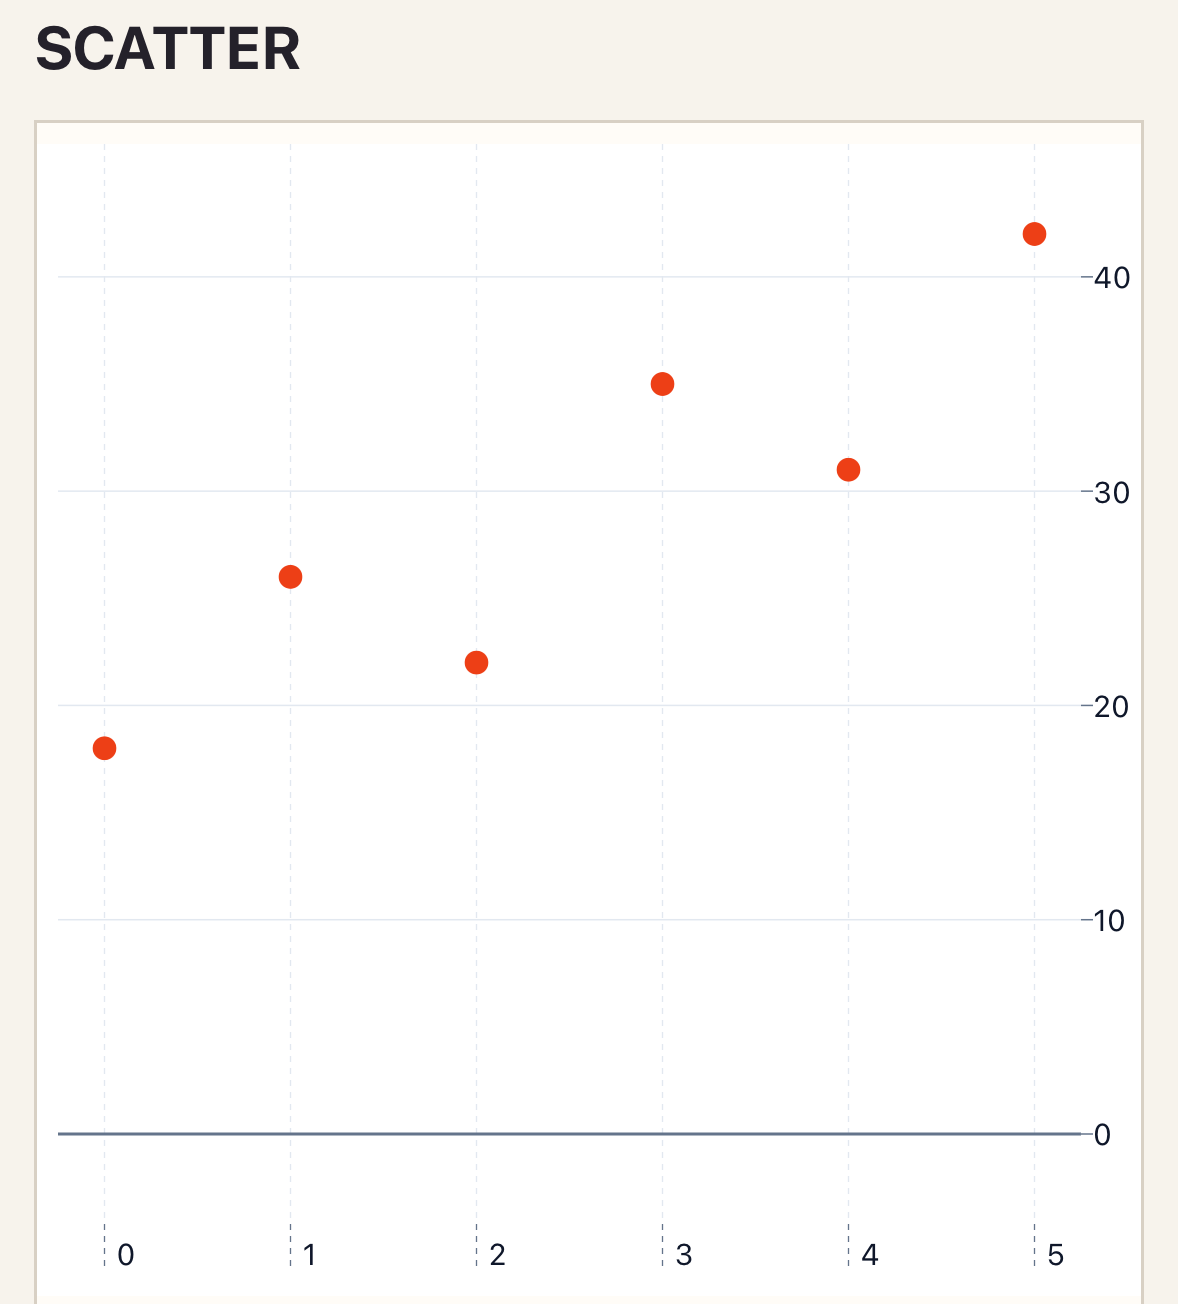
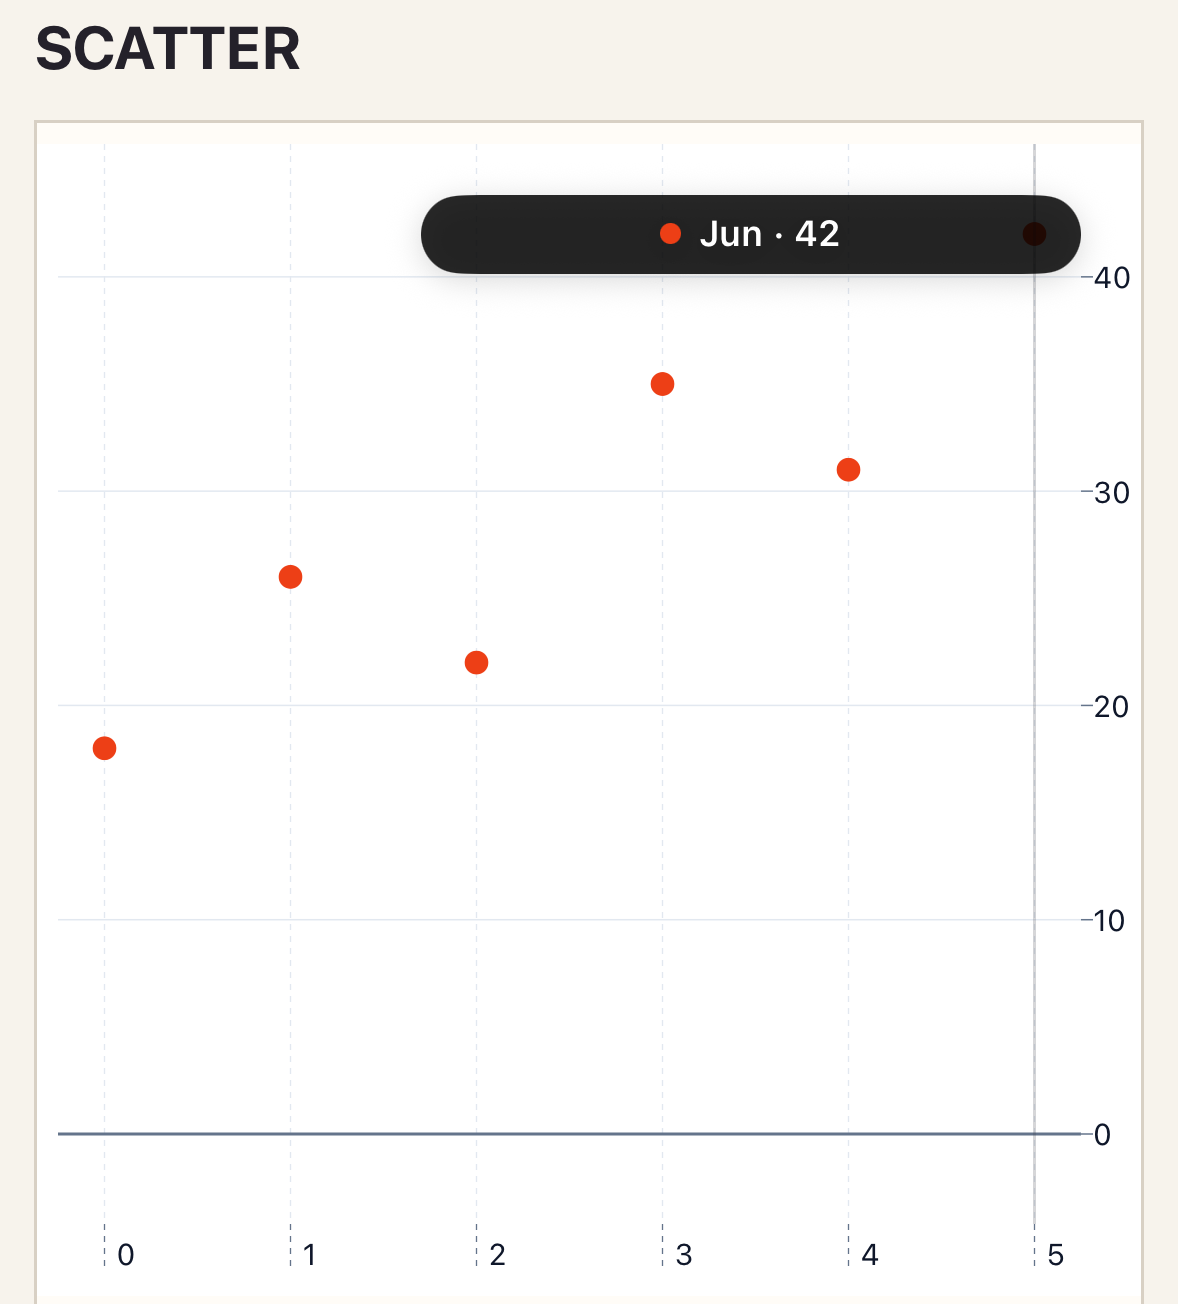
Section titled “Native preview”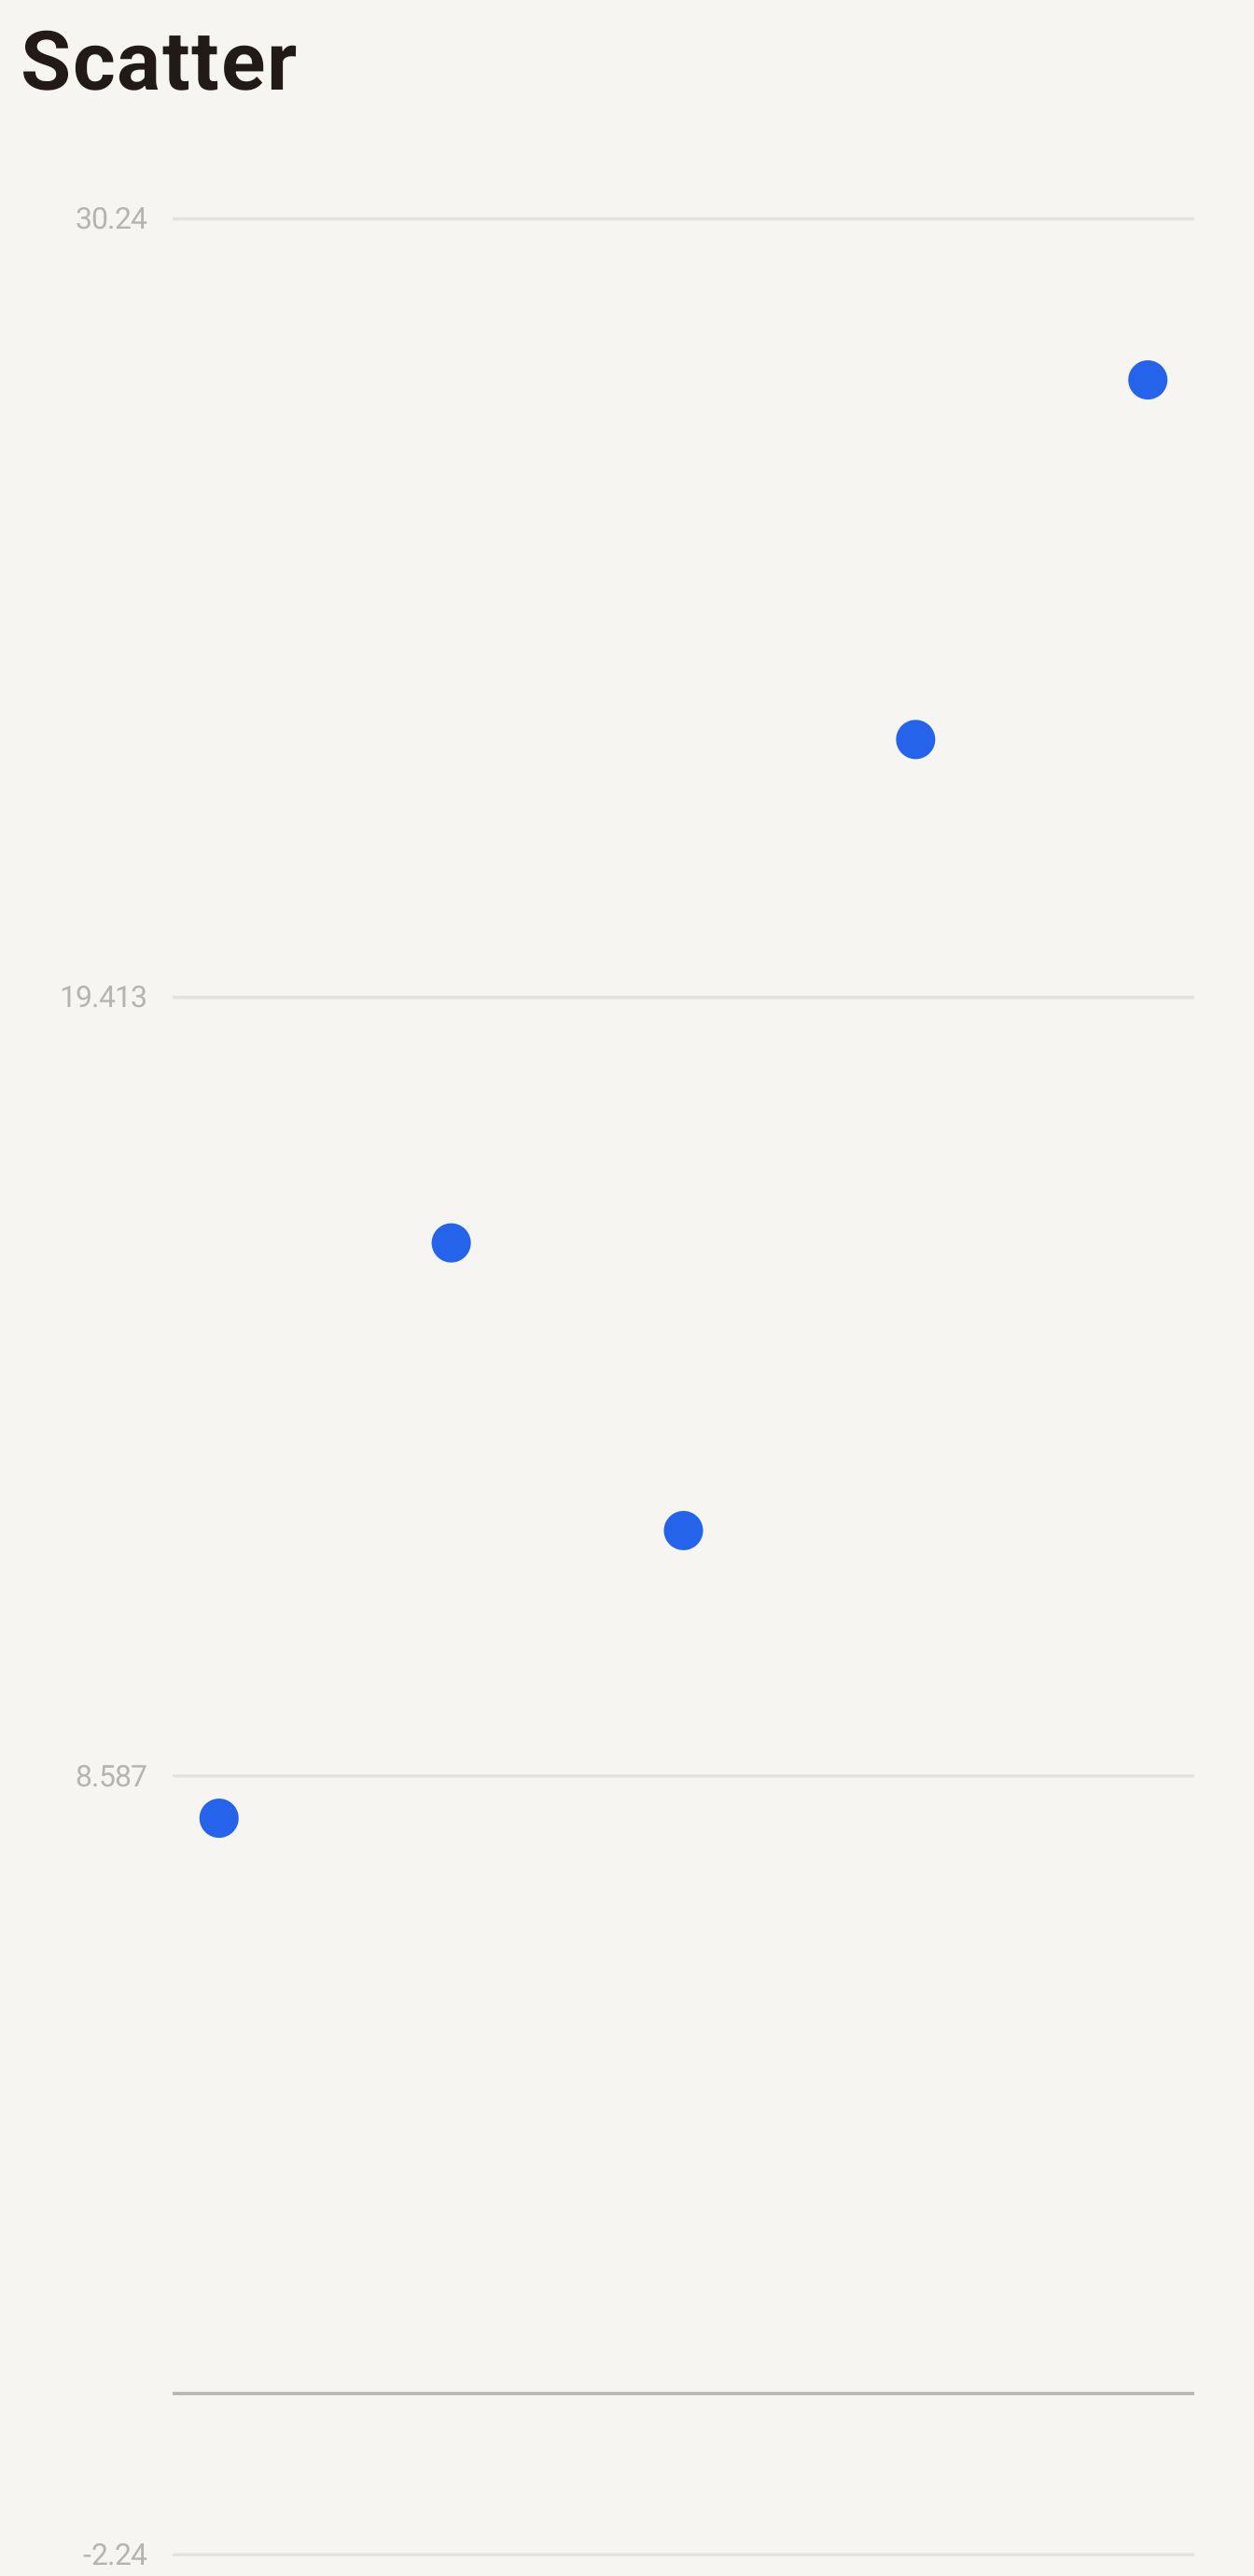
Variants
Section titled “Variants”Use multiple series to compare cohorts. Numeric and datetime x axes support continuous viewports.
Customization
Section titled “Customization”Use point size and color to distinguish series without encoding critical meaning through color alone.
See the style options reference for supported keys and ranges.
Interaction
Section titled “Interaction”To handle selection, add _select="selectPoint" and define the method shown in Callbacks and interactions.
A selection reports the series, point, x value, numeric value, and label. Pan and zoom are available for continuous axes.
Empty and error states
Section titled “Empty and error states”An empty series list renders empty-label. Missing numeric x values are invalid; a rejected native snapshot uses error-label.
Accessibility
Section titled “Accessibility”Give every point a useful label and provide a text summary for dense distributions or important outliers.
Scatter uses the Cartesian contract, defaults x to number, and accepts points, grid, and axis style sections.
Troubleshooting
Section titled “Troubleshooting”For dense plots, reduce the displayed range or measure a sampling strategy before hiding observations. See performance and evidence.