
Line chart
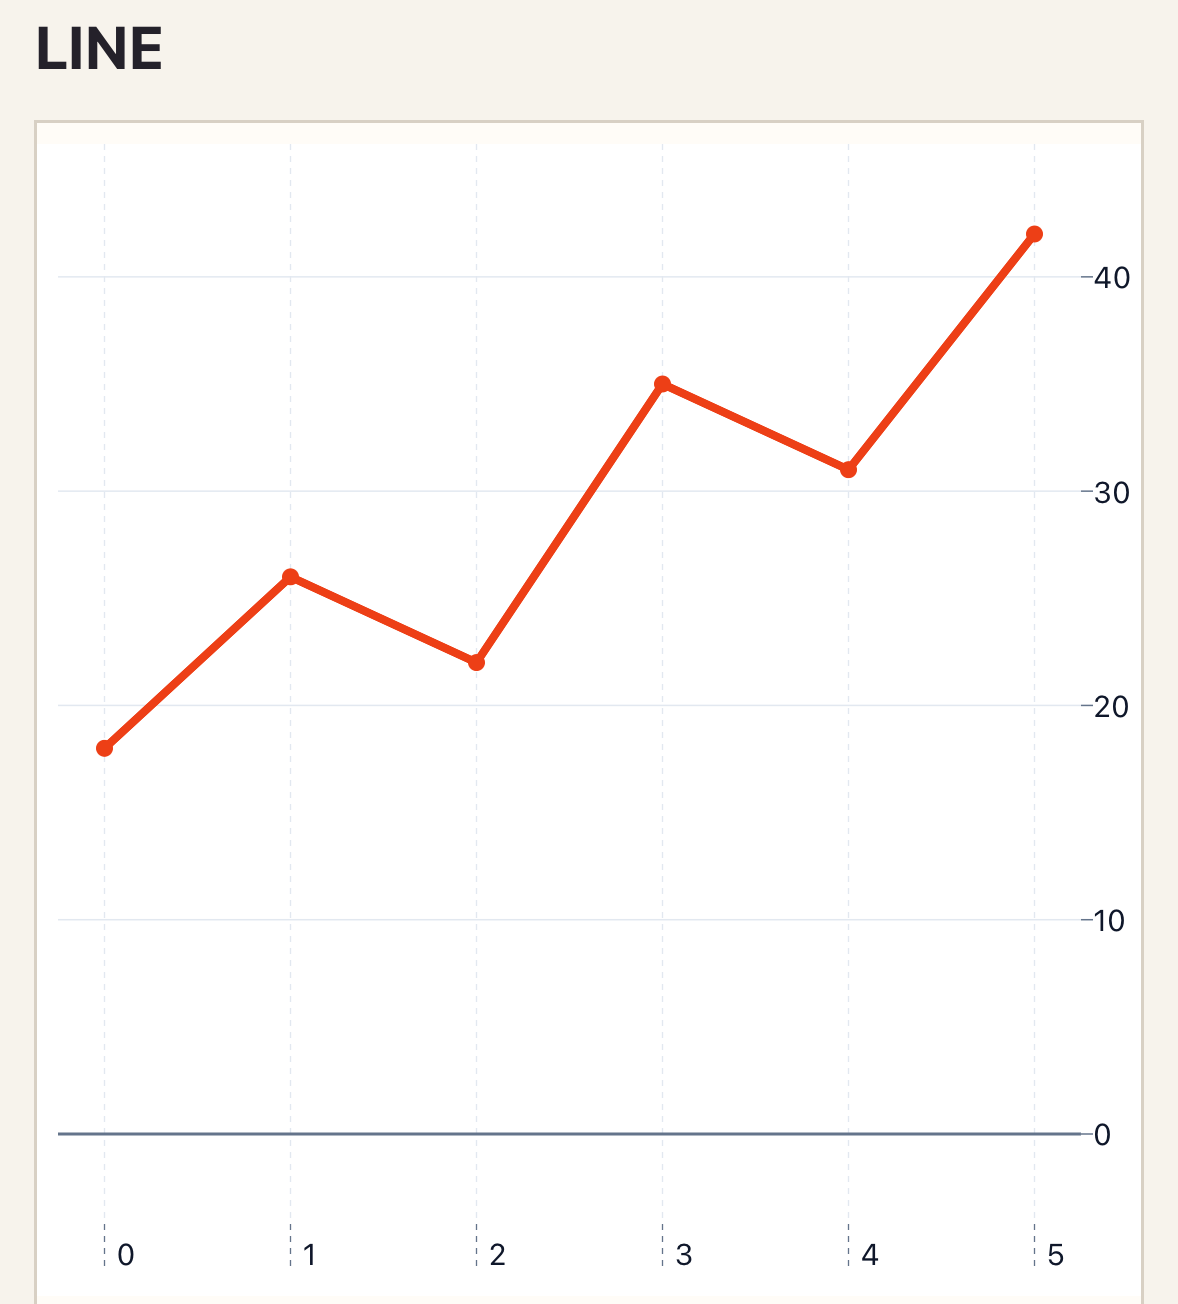
Use a line chart for an ordered trend. Use explicit series.id and point.id values whenever selection must survive insertion or reordering.
When to use
Section titled “When to use”Choose line for change across time or another continuous ordered domain. Choose bar when the x values are independent categories.
Minimal example
Section titled “Minimal example”Add this element to a native Blade view after installing the package. The example includes its data; replace the values with your own.
<native:line-chart class="w-full h-80" :series="[ [ 'id' => 'revenue', 'name' => 'Revenue', 'color' => '#ED3F16', 'points' => [ ['id' => 'jan', 'label' => 'January', 'value' => 18], ['id' => 'feb', 'label' => 'February', 'value' => 26], ['id' => 'mar', 'label' => 'March', 'value' => 31], ], ], ]" theme="system" preset="default" error-label="Revenue chart unavailable" a11y-label="Revenue by month"/>series is an ordered list of series with id, name, color, and points. Each point contains id, label, value, and an optional typed x.
Native preview
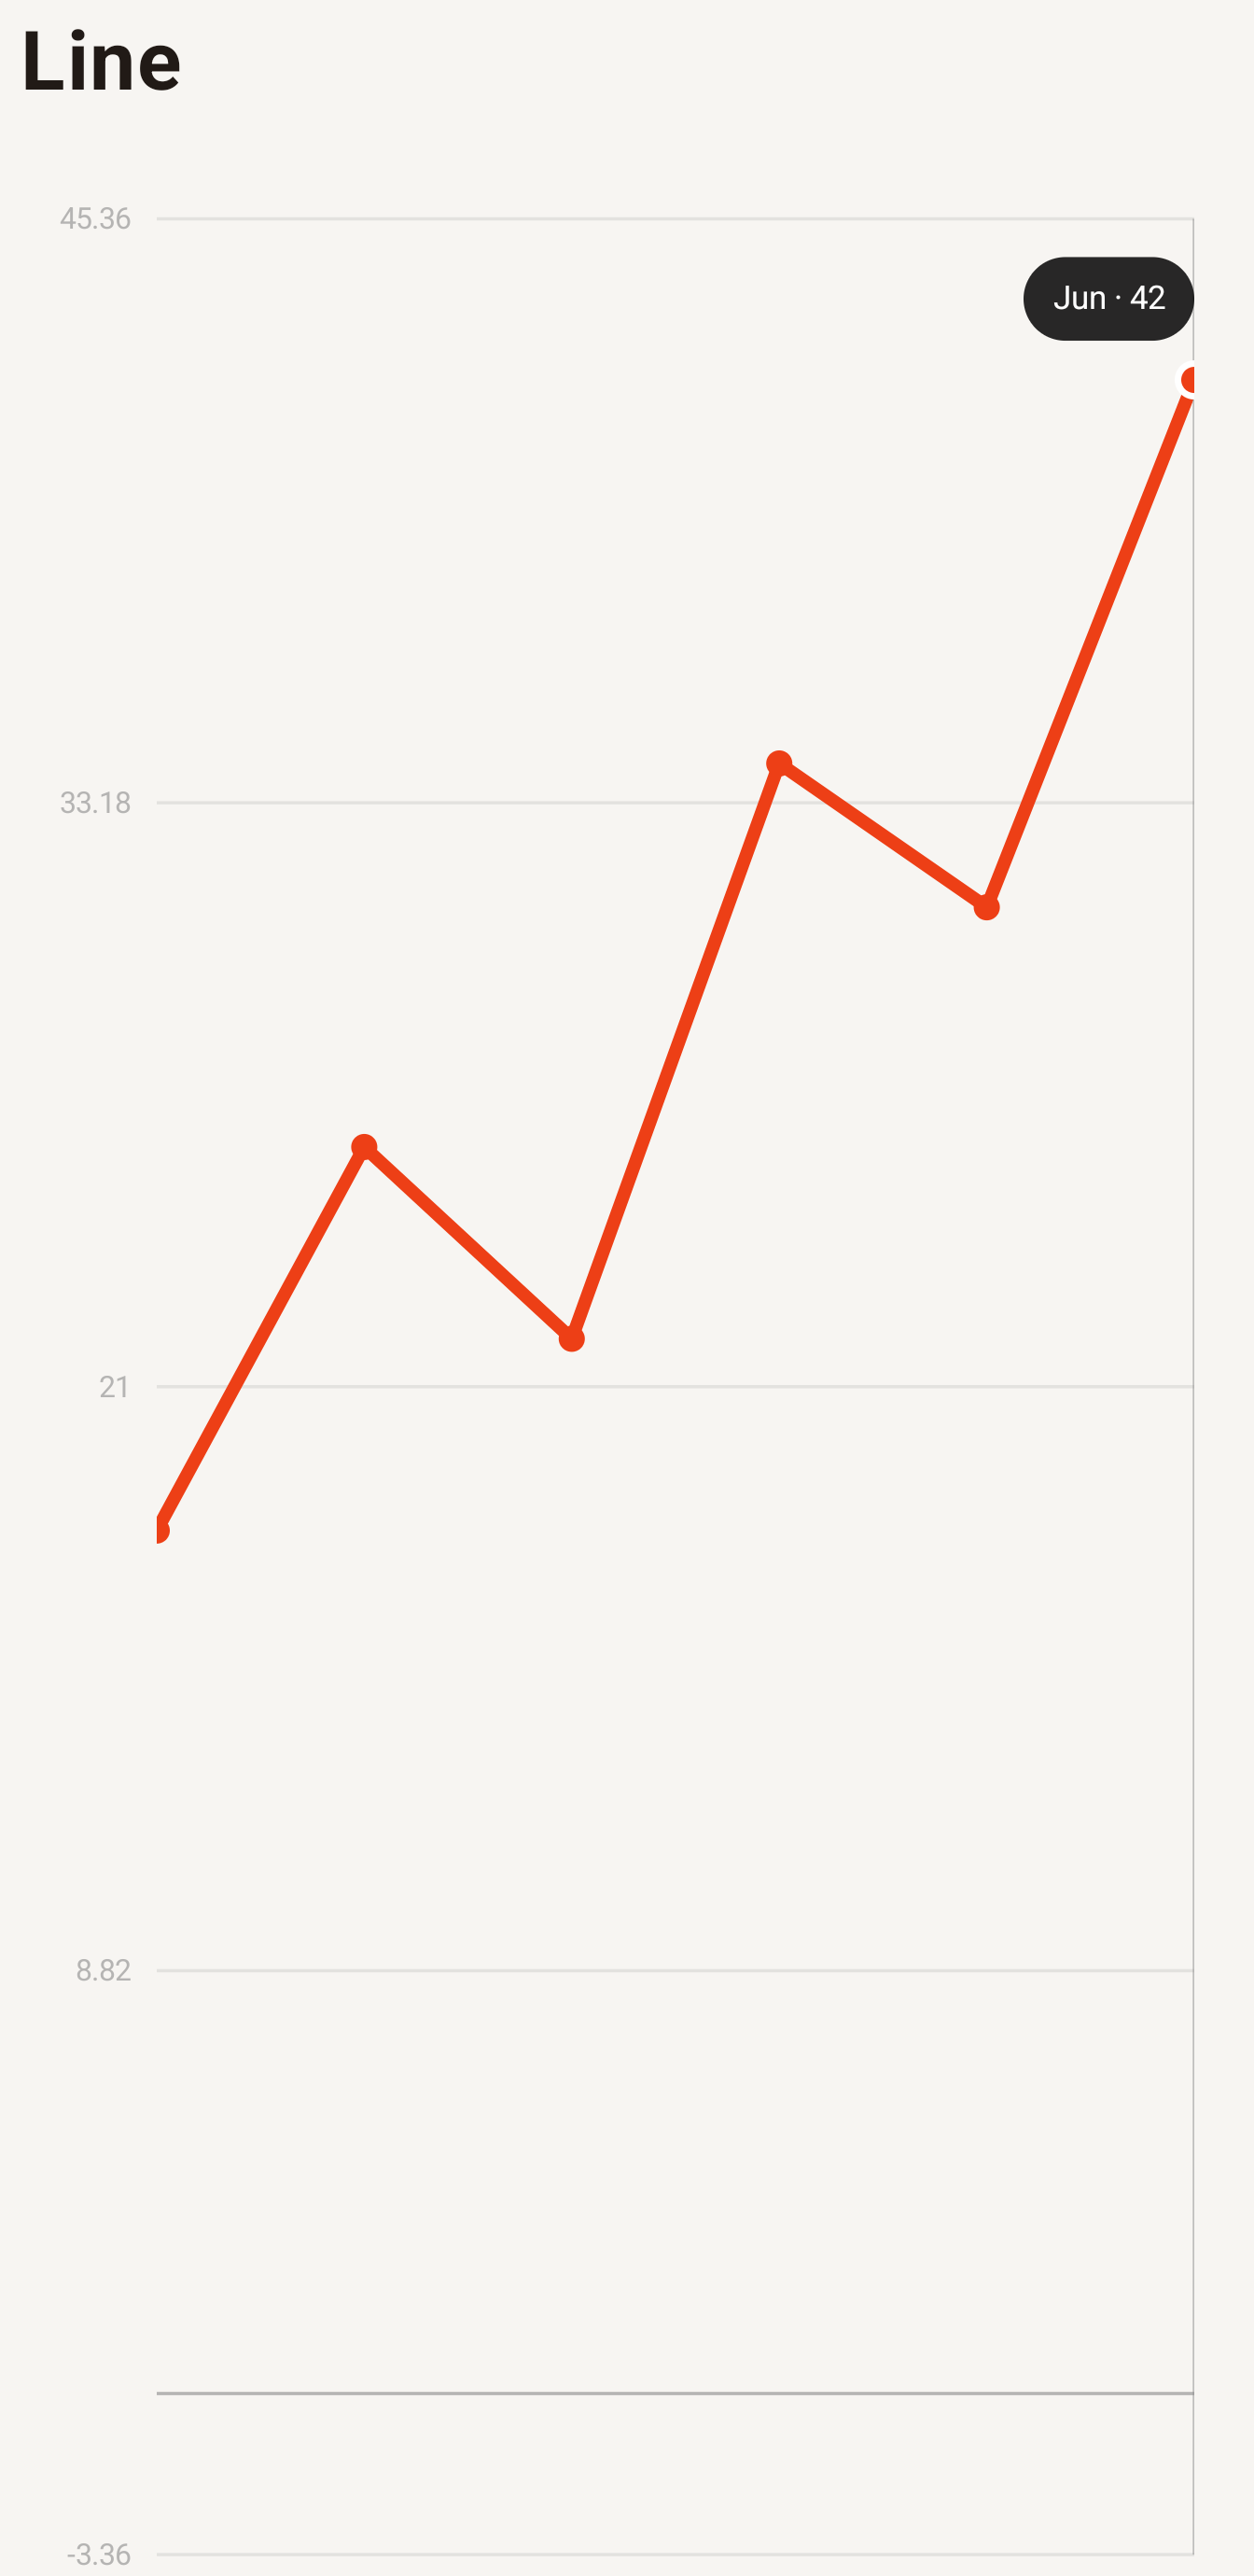
Section titled “Native preview”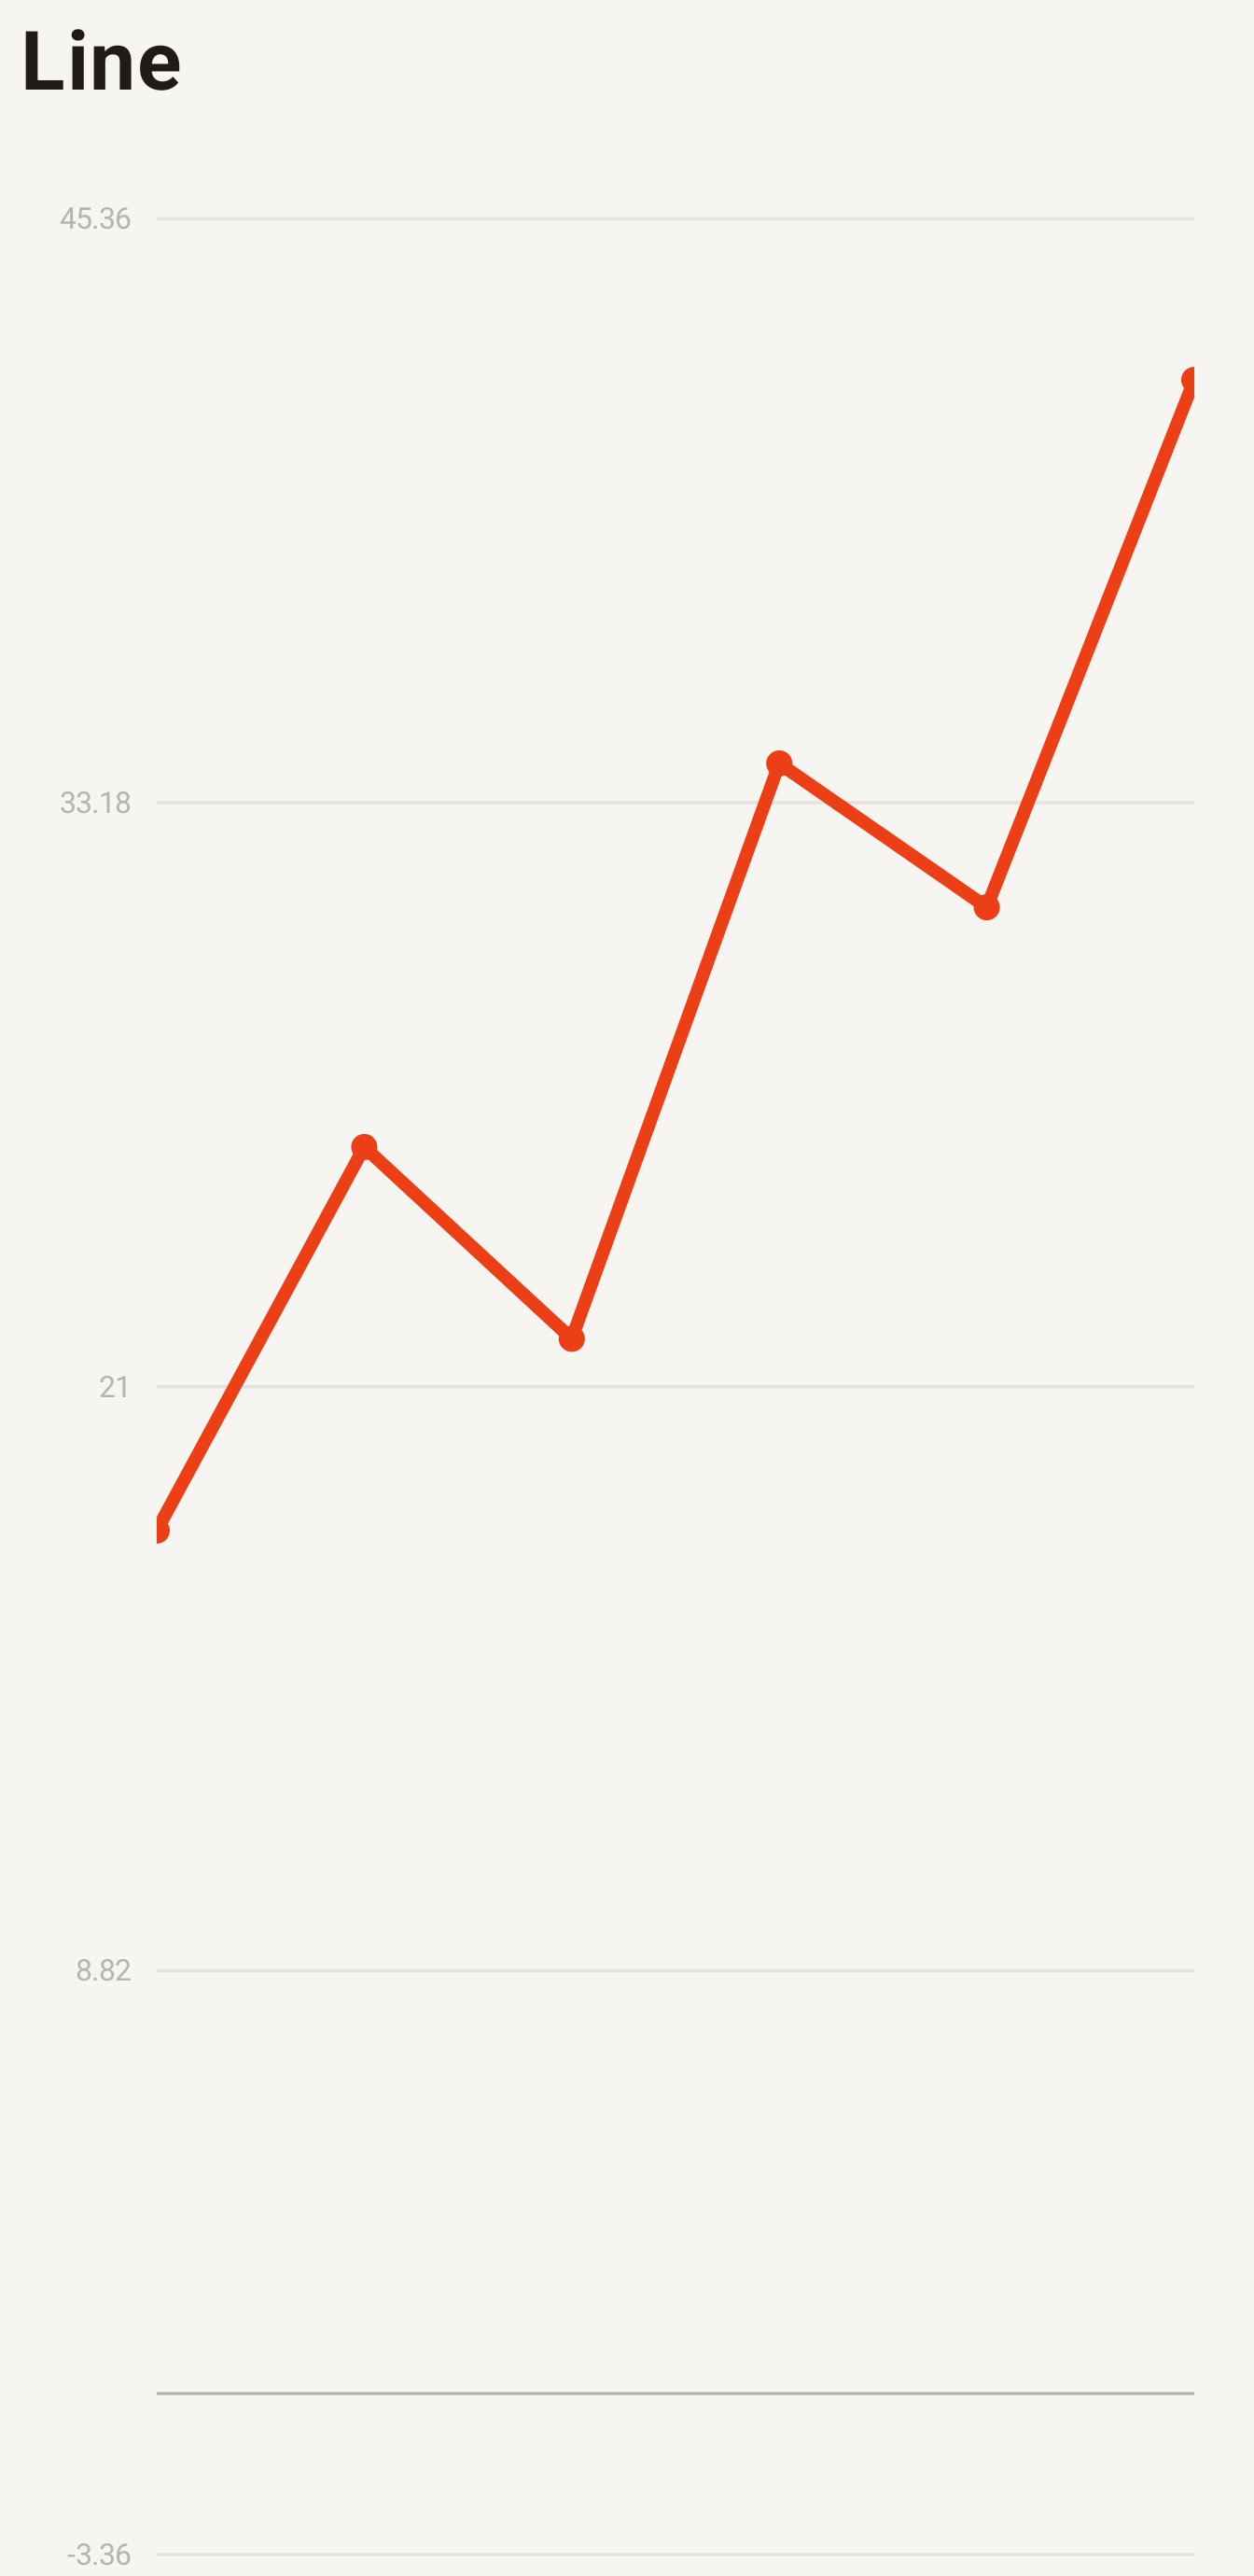
Variants
Section titled “Variants”Use multiple series for direct trend comparison, and a date, datetime, or numeric x axis for continuous data.
Customization
Section titled “Customization”Set theme, preset, or semantic style sections for line width, points, grid, and axes. A series color overrides the preset palette for that series. Do not use a line chart for unordered categories.
See the style options reference for supported keys and ranges.
Interaction
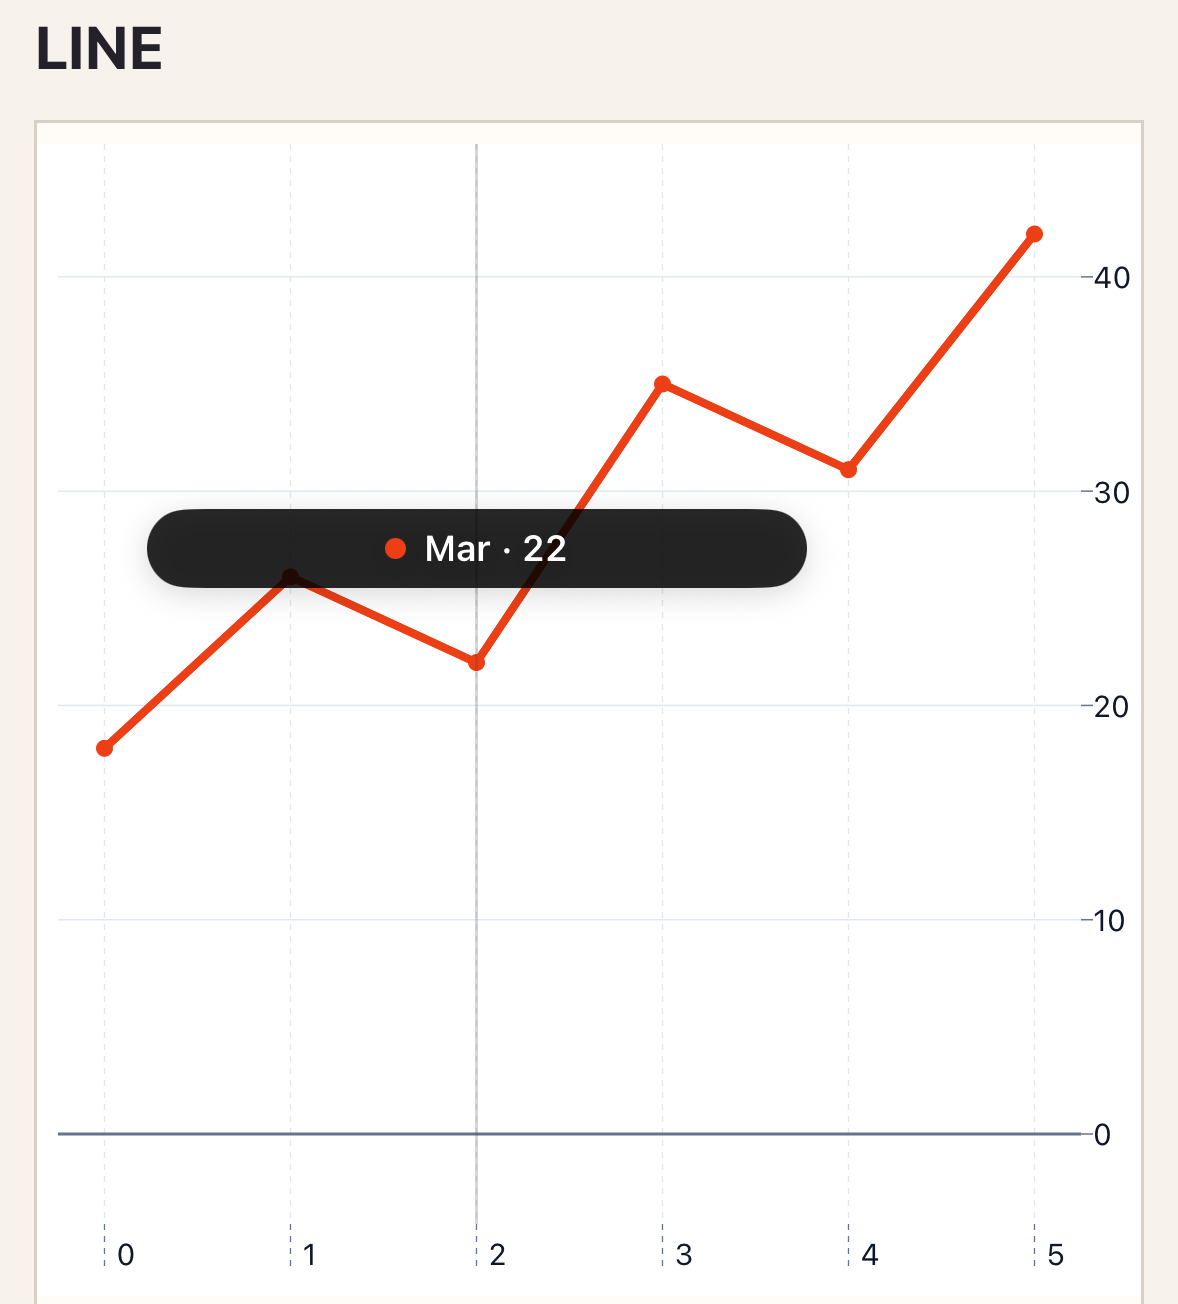
Section titled “Interaction”To handle selection, add _select="selectPoint" and define the method shown in Callbacks and interactions.
_selectreceives one completedPointSelection, never an event for every animation frame.- Number, date, and datetime axes may enable a viewport.
on-viewport-changereports a settled pan or zoom on continuous axes.
Empty and error states
Section titled “Empty and error states”An empty list renders empty-label. An unsupported or corrupt native snapshot renders error-label; invalid PHP input is rejected before rendering.
Accessibility
Section titled “Accessibility”Supply a task-oriented a11y-label, not a visual description such as “blue line.” Keep point labels meaningful outside the drawing.
Line-specific style uses line and points. Cartesian attributes include series, x-axis, y-axis, interaction, viewport, sampling, and annotations.
Troubleshooting
Section titled “Troubleshooting”If selection moves after an update, replace compatibility-derived IDs with explicit stable point IDs. If vertical scrolling stalls, review gesture ownership.
See the common and Cartesian API.